In our jobs we contend with large amounts of stress. We all need a little time to get away, relax, or even play a game with our colleagues.
There are several ways to set up successful gamification by gathering teams to collaborate. One of these, affinity grouping, can make work activities more fun.
In this article, we’ll introduce you to the affinity grouping method. We’ll look at real-life examples to demonstrate when, why, and how to utilize it. In addition, we’ll review tools and best practices and how you can integrate product analytics to support the activity.
Table of contents
What is affinity grouping?
Affinity grouping is a brainstorming activity that aims to collect similar items together. It is an agile technique that starts by stating a problem and then having the team engage in a discussion to come up with several possible solutions. After this, the team tries to group similar ideas into the same category.
To help you organize the items, you can create theme names for each affinity grouping (e.g., cost saving issues, value added issues, vulnerabilities, legal issues, performance issues etc.), then rank and vote on the items and groups that are worth pursuing.
To aid the process, I like using colorful tools like sticky notes. Below is an example of what affinity grouping looks like:
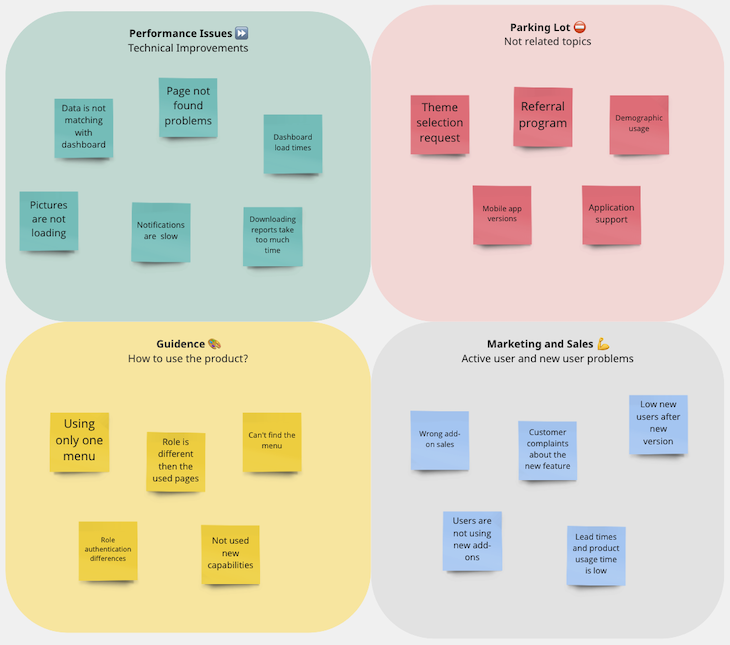
If you’re working onsite, using a white board in a room can create a better result 😊. If you are a remote worker, software tools allow you to socialize with coworkers 🧡.
When and why do you need an affinity grouping?
You can use affinity grouping for a new project, feature, or even for replatforming an existing product/feature. However, you mostly use affinity grouping when you are faced with chaos and disagreement, when large amounts of data need to be organized, or with complex problems that require teamwork.
Affinity grouping is a particularly valuable exercise for activities such as:
Grouping customer requests
Our customer experience team decided to create a customer survey for end users. Our product was a B2C product with over 1 million users. We collected insights and answers from end users, but found that our net promoter score was low.
Our goal was to increase our active end users for the quarter 🥹. We needed to engage with customers, but prioritizing that many requests was a nightmare for the customer experience team. To aid this, they asked for help from the product management team. We created an affinity group that included sales, customer experience, and product management members and then started to group answers.
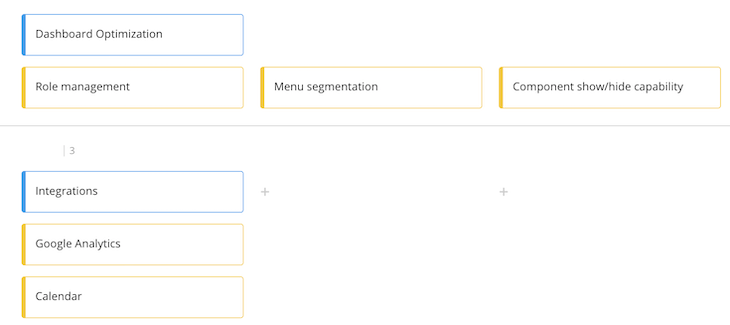
We grouped the requests into either dashboard optimization or integration (as shown in the picture below). As we found similarities, we combined like topics to decrease the overall count. You cannot stop here though. After an affinity grouping, you then need to come up with a result.
In the group work, we focused on solving customer pain points to engage them in the product. After groups were filled with requests, we started to add the number of users requested into the carts. Looking at the data, we saw that dashboard optimization ideas had the highest number of users.
We collected sales and customer success insights to reprioritize requests, or eliminate them when not applicable. From there, we looked at the job and prioritized this project within our product roadmap. We published the release notes with customers who attended the survey to show them that we were listening to their requests and improving our products alongside their support.
In the first quarter, we increased our monthly active users count and witnessed a constant retention of weekly/daily users. Small development efforts allowed us to grow without trying to find complex new features:
Grouping large amounts of data
The product management team decided to collect some additional metrics from Google Analytics that our development team had added for monitoring. We collected country, user role, industry based usage, demographic distribution, as well as screen time and new feature monitoring.
The product was mature enough that we already had some insights from customers, sales, and marketing, but the analytics fell short of our expectations. We continued monitoring for several weeks and observed no change.
Because of this, we decided to start a brainstorming event with the development and QA team. We returned to the data collected by Google Analytics and added every possibility that could cause improper data collection.
After the brainstorming event, we grouped our ideas under topics like technical problems (wrong metric matching, database problems, etc.), lack of customer training/guidance, role/authentication problems, sales problems (selling wrong add-ons, pairing capabilities with wrong industries), and device problems.
We voted and gave points to the issues according to their resource/day requirements, feasibility, and ability to solve through customer interaction. Lack of training and role problems received the most votes, so we started on them. We added some features like allowing only one user to login on a device at the same time, hiding the unnecessary menus according to the roles, Q&A pages, and training videos.
Subscribe to our product management newsletter
Get articles like this to your inbox
We discovered the real problem with the help of the support team. They reported the most problems with logins 🤭. Customers were not closing their app sessions on their computers, or were sharing their passwords with one another, causing different operation users to use different user roles.
The support team created a new login for each user if they didn’t have one already. After several weeks the numbers started to align with our expectations and we began to trust the data that we were collecting. With that trust we started to use numbers to direct every project decision that we have.
Building team relations
When Covid-19 first hit, we immediately started working from home. We weren’t ready and didn’t know how to contend with this unprecedented work environment. Our new team members came onto the team without ever seeing each other. People started to fixate on daily work and the team began to feel distant. We tried turning on our cameras and creating town halls and events, but these crowded events didn’t solve the internal team loneliness.
In our product backlog we had a new mobile application replatforming project waiting for prioritization and we decided to give it a chance. We collected the team and started to work together. We ran brainstorming sessions, discussed together, grouped our ideas, found new solutions, and separated smaller teams to collect data again for other sessions. Throughout the process we shared update messages to all teams about our progress.
After maturing the ideas, we started grouping them and separated some. To make the process more like a game we assigned funny names to each group. After this we voted on the groups and created a roadmap together. At the end of the sessions the team was motivated to develop a new product. Working together created a shared knowledge that helped streamline our development process.
How can you collect ideas from perfectly created groups?
The group you select has a great impact on your results, so you should be careful about group and method selection. You will collect many ideas, which can be biased or misguided without proper attention to group selection. Below are three common groupings and their respective strengths:
Internal team (such as development, QA, product management)
These employees mostly cover technical issues. If the issue doesn’t have a direct impact on the business process, you can solve it internally.
External team (such as marketing, customer experience, sales, operations)
The external team also represents colleagues inside the company, but from different departments or disciplines. We collaborate with them to learn the business side of the problem, ask about sales and marketing problems, or hear any complaints they may have.
End users
End users may not be the perfect source for voting, but they are perfect for gathering ideas and pointing out problems in their early stages. Customer surveys, interviews, and NPS methods can be used to direct business decisions. We also collect insights from forum sites where users complain about our products 🌐
Before Covid we used a white board and sticky notes to brainstorm. These face-to-face methods were possible when together in a meeting room. With remote and international working methods, we started to use different tools. Below are the four most common tools we use:
IdeaBoardz
IdeaBoardz is a free tool we also use for our Retro sessions. It is easy to login and use. You can see your earlier activities as well. Anonymous usage makes it good for these kinds of activities. You can also easily vote on the stickies you create after completing affinity grouping.
Google Docs
We love using Google Documents because it is easy to use and again free 🙂. We keep our project documents, meeting notes, and everything inside excel sheets. However, Google won’t make your activity feel fancy. Because of this, I prefer more colorful tools for brainstorming and affinity grouping activities.
Miro
Miro is also free and a better application for such activities. We should keep the team inside the activity and help them to be creative. Miro can help them focus easily and create a game area with their ideas.
Lucidchart
You can sign up for free or pay if you want more capability. Lucid is a good tool for product structures and designs as well. I find it easy to use and it offers enough for idea collecting. However, voting and grouping in Lucidchart are not as easy as other ideation tools.
LogRocket
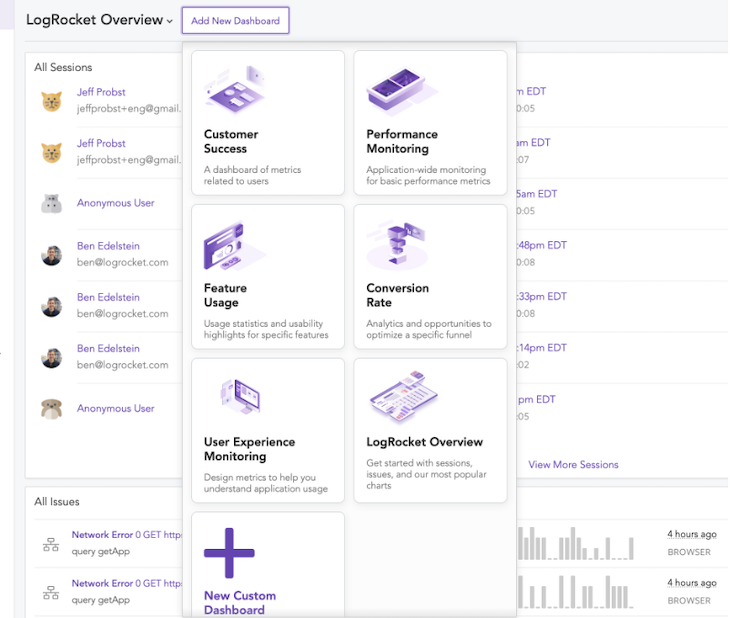
LogRocket has a powerful dashboard for you to see how your users are interacting with and experiencing your app in aggregate over time. We use the affinity grouping method for gathering data and creating meaningful insights from them.
LogRocket makes it easy to monitor new and existing parts of your app for errors, performance problems, and usability issues that can inhibit feature adoption and prevent users from converting.
From the logs, you can find the issues that your technical team needs to begin affinity grouping activities. LogRocket allows you to bypass data analysis and jump right into ideation, grouping, and then voting on results:
Conclusion
I started out by suggesting the affinity grouping method as a type of game that allows you an opening to tackle business problems. We can also think of it as our playground where we can get together and share good moments with our team. Even solving problems can be fun.
With affinity grouping you state the problem, find the correct team, and then move through idea sharing and creating new topics. You can create a powerful team with methods like affinity grouping. If needed, I will always be happy to join your brainstorming group 🧠.
LogRocket generates product insights that lead to meaningful action

LogRocket identifies friction points in the user experience so you can make informed decisions about product and design changes that must happen to hit your goals.
With LogRocket, you can understand the scope of the issues affecting your product and prioritize the changes that need to be made. LogRocket simplifies workflows by allowing Engineering and Design teams to work from the same data as you, eliminating any confusion about what needs to be done.
Get your teams on the same page — try LogRocket today.
Source link