Imagine you have been tasked with solving a problem: customers are experiencing lag while attempting to check out from their carts. Specifically, the app takes two minutes to transition from the cart page to the payment page once a customer clicks Continue.
What would you do? The first question that comes to mind is “why,” right? To answer this question, you’ll need to identify all the steps that customers take when checking out, and then assess how each step is performing. Together, these answers will enable you to determine the exact point in the checkout process where the problem is occurring.
This is called “root cause analysis” — you tried to list all the possibilities that could have created this problem. And out of all possibilities, you found which likely created the problem.
Let’s refer to the problem as the “effect,” and all the potential causes you identified during your analysis as the “causes.” Now, imagine trying to represent this cause-and-effect analysis visually. What types of diagrams could you create?
Maybe a tree whose roots are the effect and all the branches as the cause(s). Or maybe an Excel table listing all the causes and sub-causes in columns. Those are all good options, but in this article, we’ll discuss a cause-and-effect diagram (also called a fishbone diagram or Ishikawa diagram).
Table of contents
What is a fishbone diagram?
To start, a fishbone diagram (or Ishikawa diagram) is a tool to visually explore and represent the possible causes of an effect. The tool helps in identifying the potential causes that could have caused the problem.
A sample fishbone diagram looks like this:
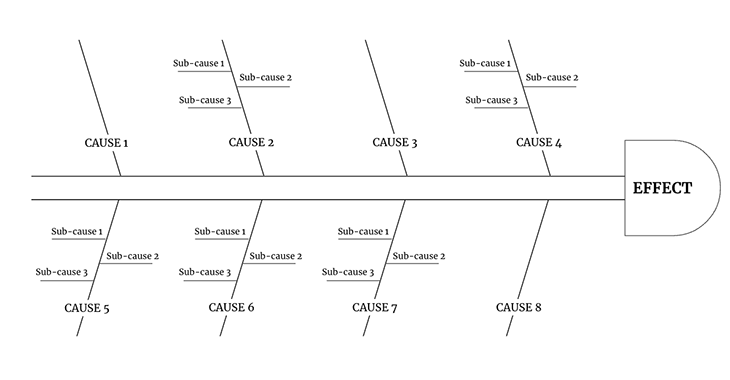
It is called a fishbone as it looks like the skeleton of a fish. The head of the fish explains the problem statement (or the effect) and the bones attached explain the possible cause and sub-causes.
The history behind fishbone diagrams
Although the early history of fishbone analysis is slightly unclear, fishbone diagrams are believed to have been in use since the 1920s. However, it was during the 1960s that the diagram gained widespread popularity, thanks to the work of Dr. Kaoru Ishikawa on quality management processes for Kawasaki Shipyards.
It’s believed that Ishikawa first presented the fishbone analysis method in 1945, as part of the development of a company-wide quality control process. The creation of quality improvement processes and tools, along with the introduction of quality circles, played a significant role in the evolution of the concept of total quality management. The Ishikawa diagram became recognized as one of the seven basic quality tools.
When to use a fishbone diagram
The purpose of the fishbone diagram is to identify all the root causes of a problem. You can use fishbone analysis in product development — let’s list a few cases where you should use fishbone analysis:
- When you have to identify the possible causes of a problem
- When you have to develop a feature or product to fix the cause of a problem. This is a reverse analysis where business analysts find the gap in market need and fill that gap with a product or feature
- When evaluating a business process to find loopholes or gaps that create problems
- When you’re defining a process for quality control. Evaluate and find the current gap in quality and build processes to fill it
You can apply the fishbone analysis tool to most applications that need an establishment of quality control and management.
Now, we’ll go over the fishbone diagram and how you can apply it to multiple industries. Most businesses fall into one of these operation areas: services, manufacturing, and marketing, each of which can use a different fishbone diagram. While manufacturing may not be directly relevant to digital products, the fishbone diagram can still be a useful tool for uncovering problems and identifying potential causes. You can modify them accordingly to fit the context of your product.
The 4 Ws
Let’s start with the 4 Ws: what, why, when, and where. Applying these will help you find the possible potential causes for any effect. This is a good way to brainstorm and all fishbone diagrams must start with these, regardless of the industry you’re in. The 4 Ws are:
- What? There will be materials, products, lines of code, and other resources involved in the problem creation. Ask “what?” to help to pinpoint the specific components or resources that may be contributing to the issue
- Why? There will be situations or conditions that lead to the problem. Asking “why?” may help to uncover factors such as network failure, temperature, weather conditions, or other external considerations that may be impacting the system
- When? There will be a moment when a particular problem occurs. Ask “when?” to find out the time the problem occurs and figure out if it’s a recurring or isolated incident
- Where? Asking this question can help to identify specific areas, such as during the checkout process, a different part of the application, or within a specific context where the issue is most prominent.
The 5 S’s
Many businesses in the service industry indeed share similarities when it comes to cause analysis in their operational areas. Specifically, the 5 S’s (systems, suppliers, surroundings, safety, and skills) can be applied to cause and effect analysis within the service business.
While all service businesses don’t need to conduct a complete cause analysis using the 5 S’s, many find that these principles can be applied at the initial levels and then gradually approached more thoroughly as they identify potential causes within their unique environment:
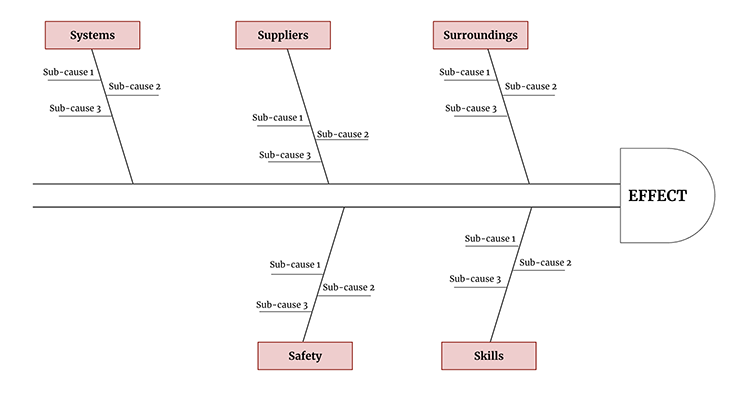
Systems are the methods, policies, processes, products, and tools used to build operational excellence and provide service without any failure.
Suppliers are any issues in delivering the service itself, like lower quality of service, failure to support customers, delay in refunding payments, agents or vendors delay, and more.
Surroundings are any external factors such as market, competition, public relations, brand value/image, etc. that may contribute to the issue.
Skills focus on finding issues in training, qualifications, skill set, and the experience of employees providing the service.
Safety focuses on finding issues in the system’s overall safety, products, operational procedures, and work environment.
The 6 Ms
Though the 6 Ms apply mainly to the manufacturing industry, you can transfer this framework into the software industry as well. Since digital products don’t have physical parts, not all of them will be relevant, but we’ll highlight them anyway:
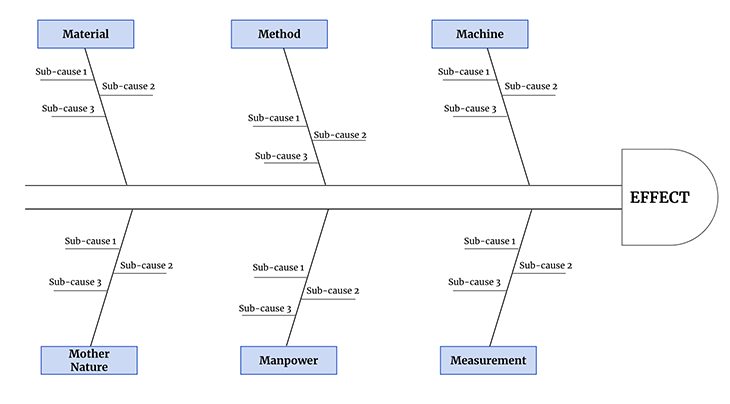
Material focuses on finding issues in any raw materials used for manufacturing. This includes issues with the quantity or quality of supplies, any issues with the timeline of procurement and supply, and more.
Method focuses on finding issues in processes, policies, regulations, training, and guidelines used by companies. Though this is relevant to manufacturing physical goods, these apply to digital products as well (in context).
Subscribe to our product management newsletter
Get articles like this to your inbox
Machine focuses on finding issues in machines that are used in manufacturing (production). This will help uncover any issues with the maintenance of machines, any failures in the machine or assembly line, etc.
Mother nature, aka the environment, focuses on finding issues in environmental conditions. For physical goods, this could mean issues with temperature, light conditions, etc. For digital products, this could mean issues with servers going down, weather causing latency problems, and more.
Manpower (aka people) focuses on finding issues in the workforce. This means any issues with the work itself, employee burnout, training and skill sets, and more.
Measurement focuses on finding issues in measuring the process and results. This is huge in any business, as metrics and measuring success are vital to the health of a company. Use this to find any issues in quality readings, calculations, and more.
The 7 Ps
There are 7 Ps that can be commonly applied in cause analysis. These are all related to marketing businesses, but nearly all physical and digital products have marketing functions that affect their product and that this can apply to:
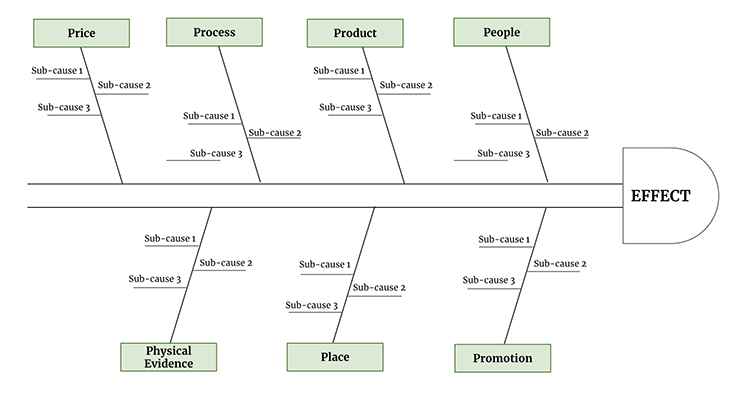
People focuses on finding issues in people involved in marketing a product or service to customers. This implies issues with not targeting the right audience or marketers not having a good understanding of the product.
Product is focused on finding issues in the product or service of an organization. This could be several things, including the perceived image of the product, issues with availability to reach customers, or failure to meet customer needs.
Process works on finding issues in procedures for promoting and marketing the product or service. Are there any gaps in cross-functional team collaboration? Are they any issues with the escalation matrix?
Price is a big one. This is where to uncover issues in the pricing of the product or service. Is the price too low? Maybe it’s too high? Are there any issues with the price range not matching the competition or with accepting certain payment methods?
Promotion focuses on finding issues in promotion methods, mediums, and strategies. Are social media advertisements reaching the right audience? Is it generating enough clicks?
Place identifies problems with the location of your product. Are there any issues with the availability of your product on particular devices?
Physical evidence is the last of the Ps. It focuses on finding issues in the direct visibility of your product or service. If it has a physical component, is there a problem with the packaging? Physical evidence literally implies any physical issues with the product getting into the hands of customers.
Advantages and disadvantages of fishbone diagrams
There are many advantages you carry when you use a fishbone diagram as a tool for your cause analysis, including:
- Simplicity: the visual representation is simple and easy to understand. Anyone who understands the problem can easily go through all the possible causes of that problem
- Flexibility: you can dissect the cause into sub-causes and go deeper to find the cause
- Associativity: any cause becomes a potential candidate to generate the effect. The relationship with the problem is tightly defined, helping you conclude your analysis
- Ease of use: it’s easy to brainstorm with a team and explain how to use the diagram. Everyone can instantly adapt and be involved in a brainstorm
- Fast: it helps you analyze the root causes quickly by applying the 5 Why’s and drill down potential causes
- Prioritization: visual representation helps you to prioritize your causes and narrow down the most important ones
There are also a few limitations that can make fishbone diagrams difficult to use, including:
- Causes may not be as relevant as you once thought. This could lead to confusion on the path forward or create another problem by accident
- If oversimplified, the fishbone analysis may not uncover what you’re looking for
- There’s potential to prioritize smaller causes over critical ones. Since prioritization is so easy, the team may focus on small causes and waste time in fixing them
- The more dissection into sub-clauses you do leads to more complex diagrams. These may eventually become messy and difficult to understand
- The analysis is mostly based on understanding and brainstorming. It needs additional evaluation of the cause, which in case all possibilities have to be evaluated, can become inefficient and time-consuming
Fishbone diagram template
If you’d like a fishbone diagram template to work with, you can download this one I made on Google Sheets. Feel free to make a copy of it and customize it for your own use.
If you’d like to try to create a fishbone diagram yourself for your own team and organization, here are some common steps to make and analyze it:
- Identify and write the effect (problem statement) as the fish head
- Brainstorm and identify major causes. Write a major cause on each side bone. These major causes can be the Ms, Ps, or S’s with regard to the industry you’re in, or a combination of multiple
- Brainstorm and identify sub-causes. Write the sub-cause on each smaller bone
- Check for completeness. Evaluate or review for too few causes or narrow it down if you have too many
- Analyze each potential cause to narrow it down further. The goal is to end up with one or more that need to be fixed
- Prioritize the potential cause based on its severity on the effect
Let’s draw the fishbone diagram for a digital product. We’ll use the problem we listed at the beginning where customers are facing problems during the checkout process:
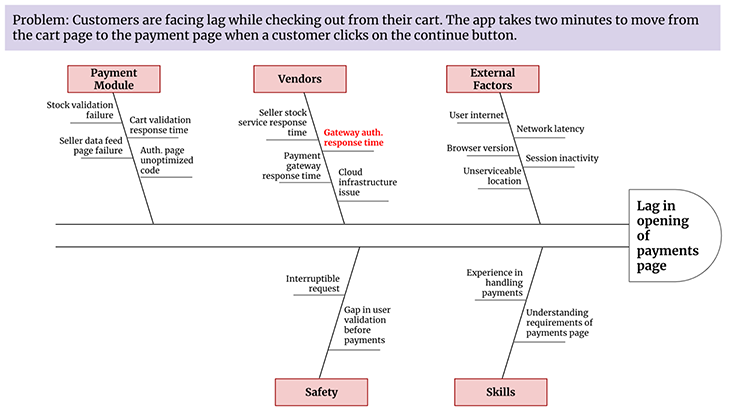
While this list may not be comprehensive, it does cover many potential causes that could lead to delays in opening the payments page. It’s important to note that during a brainstorming session, many potential causes can arise, but it’s important to focus on the most likely causes to address first. In this case, we’ve highlighted a sub-cause in red that represents the result of the analysis and the area that should be addressed.
How product managers can use fishbone diagrams
There are many cases where product managers have to analyze the cause of a problem, and a fishbone diagram is a powerful tool for product managers to benefit from. Its easy and quick creation helps quickly narrow down potential causes and act upon them.
A few examples where product managers can make use of fishbone diagram are:
- Finding the root cause for a reduction in feature usage
- Finding the root cause of churn
- Learn the effects of new features on the application upfront
- Analyze what the team should focus on while prioritizing enhancements for a feature
- Presenting the quality measures taken on certain features to senior management
The process type fishbone diagram
A not-so-popular and not-so-in-use flavor for creating fishbone diagrams is the process-type fishbone diagram. It’s very similar but has a small change in the drawing:
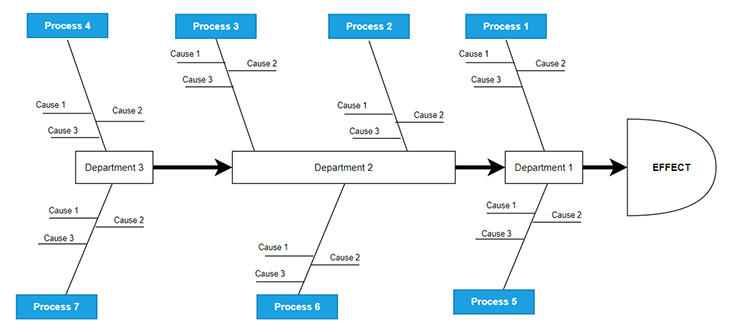
The main bone of the fish is divided into multiple cause areas. Team brainstorms potential causes that could have created the problem in each of these areas. It is called process type because each area in the main bone (mostly) represents a process, but each area in the main bone also represents a department. Causes are explored in the process of each department as a result.
These diagrams are not that popular but are an efficient way to involve multiple cross-functional teams from various departments.
Conclusion
Kaoru Ishikawa popularized the fishbone diagram to analyze the root cause of any problem. It is also called the Ishikawa diagram or cause and effect diagram.
One can use the 4 Ws — what, why, when, and where — to begin cause analysis. Based on industry type, there are common areas of cause analysis: the 5 S’ for services, 6 Ms for manufacturing, and 7 Ps for marketing. If your company or product has a combination of these, you can create multiple fishbone diagrams to get to the root cause of your issue.
Featured image source: IconScout
LogRocket generates product insights that lead to meaningful action

LogRocket identifies friction points in the user experience so you can make informed decisions about product and design changes that must happen to hit your goals.
With LogRocket, you can understand the scope of the issues affecting your product and prioritize the changes that need to be made. LogRocket simplifies workflows by allowing Engineering and Design teams to work from the same data as you, eliminating any confusion about what needs to be done.
Get your teams on the same page — try LogRocket today.
Source link