When it comes to stock investment, one of the most difficult aspects is managing your portfolio. One has to maintain a record of one’s stock holdings and keep track of the current gains or losses – all of which make it quite a hassle. But there is a simple and free way that allows you to manage your stock portfolio seemingly and that involves using Google Sheets.
By creating simple Google Sheets, you can easily track all your stock holdings and other aspects of your investment.
In this article, I am going to guide you on how to create Google sheets for managing aspects like all the stocks you hold, buying price and the current price of the stocks, your cost of buying as well as your gains and losses in numbers and percentages – that too in real-time, of-sort.
Create, and track stocks with Google Sheets
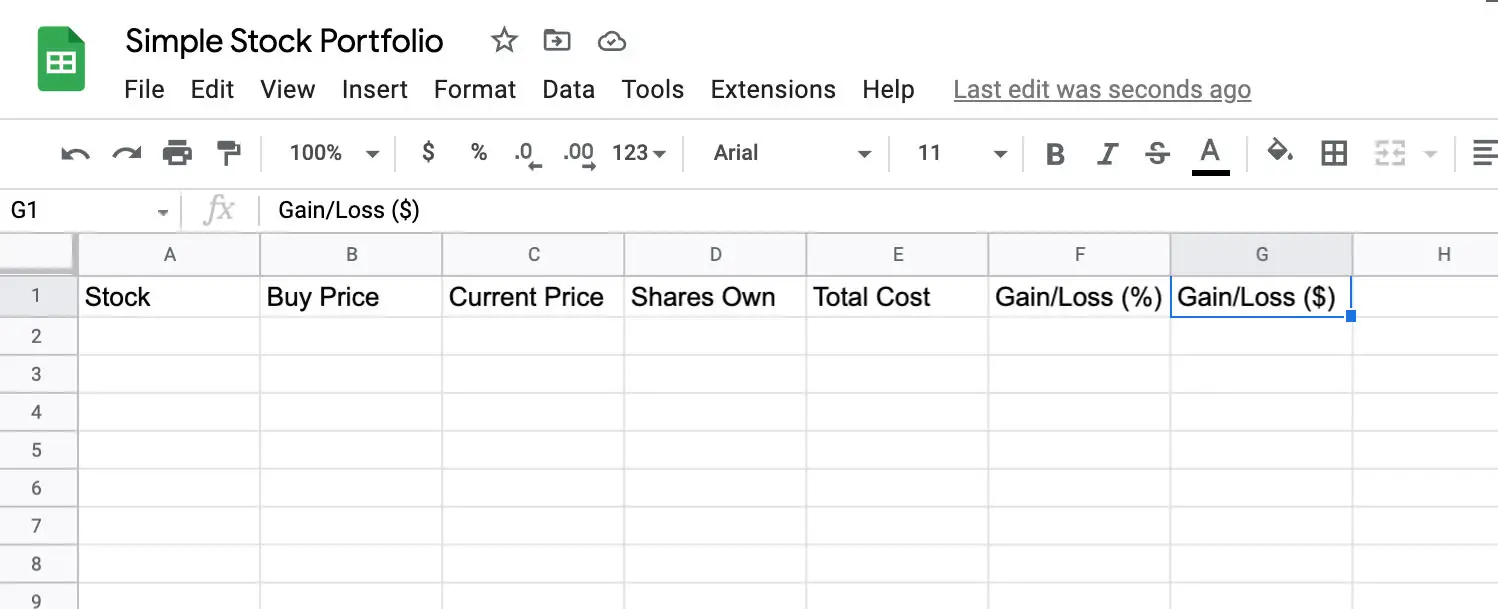
Start off by creating a new spreadsheet. Give it a name, and add the following column names:
- Stock,
- Buy Price,
- Current Price,
- Shares Own,
- Total Cost,
- Gain/Loss (%),
- and Gain/Loss ($)

Hold the Command (macOS) or Control (Windows) key, and select the columns “Buy Price“, “Current Price“, “Total Cost“, and “Gain/Loss ($)“.

On the sheet’s menu, select Format > Number > Currency.

Next, with the entire column of “Gain/Loss(%)“, select from menu Format > Number > Percent

Go to the cell directly under “Current Price“, and type in the following: =GOOGLEFINANCE(A2), and hit Enter. It will show #N/A for now and it’s alright.

Now, go to the cell under “Total Cost” and type in the following: =C2*D2, and hit .

Next, go to the cell under “Gain/Loss %“, enter the following: =C2/B2-1, then hit Enter.

And lastly, go to the cell under “Gain/Loss ($)“, enter the following: =E2-(B2*D2), and hit Enter.

Select the entire 2nd row until G2, move your cursor on top of the tiny blue square in G2, and drag it down as much as you want. This will copy all formulas in row 2 to the rest.

Before we proceed, let’s do some explanation on how this is going to work, with Apple’s stocks as an example.
Say you’ve purchased 100 shares of Apple stocks at the price of $150. You would then enter the following data in the sheet:
- Stocks: AAPL
- Buy Price: 150
- Shares Own: 100
And the spreadsheet will provide you with all the other information:
- Current Price: Current Apple’s share price according to Google Finance (Price may have a 20-minutes delay)
- Total Cost: The total amount of money (your capital) used to buy Apple shares.
- Gain/Loss (%): Your current gain, or losses, in percentage.
- Gain/Loss ($): Your current gain, or losses, in dollars.

Note: Under “Stocks” Column, instead of entering the company’s name (I.e, Apple), you will need to enter its respective ticker symbol (i.e., APPL). If you are unsure of one’s ticker symbol, try searching using this website.
You can then start populating the sheet with all your current stock holdings while it tracks and gives you an overall view of all your current gains and losses.
Hope this helps.

Source link