A great product manager should know how to use analytical tools to validate assumptions and drive product insights. One of these tools is an odds ratio analysis.
In this article you will learn what odds ratio analysis is, how to calculate it, and strategies for testing the strength of your findings.
Table of contents
What is odds ratio analysis?
Odds ratio analysis is a statistical tool used to measure the strength of an association between two events. In simpler terms, odds ratio analysis tells us the likelihood of situation A occurring when situation B has occurred.
For example, odd ratio analysis can answer business questions like:
- What’s the probability that users who adopt your new features retain better after 30 days?
- What’s the probability that users who get a marketing push notification convert better within seven days of the push?
You can use odds ratio analysis to test your assumptions and experiments to explore patterns within your product.
Odds ratio versus correlation analysis
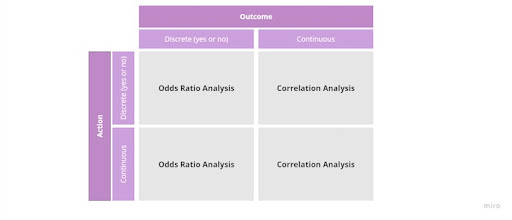
At first glance, odds ratio analysis and correlation analysis seem to answer similar questions, however they differ in the type of outcomes each seeks to analyze. Odds ratio analysis looks at discrete, or binary outcomes, whereas correlation analysis examines continuous outcomes.
We can use odds ratio analysis to analyze discrete outcomes. These are the “yes or no” outcomes, such as:
- Did the user retain after 30 days?
- Did the user convert?
- Did the user churn?
On the other hand, correlation analysis helps us analyze continuous outcomes. These are the “how much” outcomes, such as:
- How much money did the user spend with us?
- How much time did the user use the app for?
In this article, we’ll focus on analyzing discrete outcomes with odds ratio analysis. If you need to measure a continuous outcome, then check out our correlation analysis article.
How to calculate the odds ratio?
In order to calculate the odds ratio use the following four steps:
1. Label data points
The first step is gathering all the data you want to analyze and labeling it. You will need:
- A unique identifier (such as a user ID)
- Whether the action happened or not
- Whether the outcome occurred or not

(It doesn’t matter whether you use true/false, Y/N, or 1/0 for inputs as long as your analytical tool can analyze it)
For example, if you want to analyze how a particular feature adoption impacts 30 day retention, you’d need to label
- If a user adopted the feature
- If they retained after 30 days
You need both users that adopted the feature, as well as those who didn’t to have a comparison group for your analysis.
2. Create a confusion matrix
The next step is to bucket that data into four specific groups. Let’s call them quadrants:

Quadrant A — Users who completed both the action and achieved the desired outcome
Quadrant B — Users who completed the action, but didn’t achieve the desired outcome
Quadrant C — Users who didn’t complete the action, but still achieved the desired outcome
Quadrant D — Users who neither completed the action nor achieved the desired outcome

This exercise will give you four groups of users to serve as the basis for our odds ratio analysis:

For our example, let’s assume that after labeling all our data, we have:
- 74 people in quadrant A
- 55 people in quadrant B
- 55 people in quadrant C
- 44 people in quadrant D
3. Calculate odds ratio
You calculate the odds ratio by dividing the odds of the desired outcomes (e.g., retention) when users do the action (e.g., feature adoption) by the odds of the desired outcome when users don’t do the action:

To calculate the odds of the desired outcome if the user does X, we divide the number of users who experienced the action and achieved the outcome (quadrant A) by the number of users who experienced the action and didn’t achieve the outcome (quadrant B):

In this case:

Next, let’s compare the odds of the outcome even if people didn’t adopt the feature. Here, we divide people who didn’t adopt the feature, but retained anyway (quadrant C) with those who didn’t (quadrant D):

In our example:

Now that we have both these numbers, we can now calculate our odds ratio:

The odds ratio of 1.07 tells us that people who adopted feature X are seven percent more likely to retain it for 30 days than people who didn’t.
However, it’s not a definitive statement. Other variables, seasonality factors, and sometimes just pure luck influence calculations.
As a rule of thumb:
- Ignore an odds ratio between 1 and 2. There are more promising opportunities out there
- Explore areas with an odds ratio above 2
- Investigate areas with an odds ratio below 1, which suggests that the action has a negative impact on the desired outcome
4. Stress test your findings
We can derisk our odds ratio analysis by calculating the negative predictive value (NPV) and the positive predictive value (PPV) as guardrail checks.
These values help us assess what proportion of our outcomes may have been false positives and negatives.
For example, if out of 100 people that reached the desired outcome, 100 of them did the action, then it’s a powerful signal. If only 20 people did the action, but 100 reached the outcome, there’s a higher chance that the outcome isn’t related to the action. NPV and PPV help us measure that.
Below is the formula for both NPV and PPV:

The closer both of these values are to one, the stronger the relationship is between the outcome and the action.
If you achieve:
- Odds ratio: 4
- NPV: 0.3
- PPV: 0.5
Then even though the odds ratio seems promising, there’s a high chance it’s just pure luck. Consider exploring different opportunities or conducting an odds ratio analysis on a more significant sample to rule out luck.
On the other hand, the results of:
- Odds ratio: 2.1
- NPV: 0.89
- PPV: 0.79
Give us a strong signal that a specific action could potentially double the chances of achieving the desired outcome.
Always stress-test your findings.
Conclusion
Odds ratio is a powerful tool to help you validate your experiments and explore new hypotheses.
It’s used for measuring discretionary types of outcomes, and the overall process has the following four steps:
- Label your data
- Create a confusion matrix
- Calculate odds ratio
- Stress test your findings
If you are exploring new opportunities, it’s rare to get strong insights on your first try. You often need to run an odds ratio analysis multiple times with different variables to discover valuable insights.
Remember, you want your odds ratio to be above two, and your NPV and PPV as close to one as possible for an insight to be worth pursuing.
The post What is odds ratio analysis? appeared first on LogRocket Blog.
from LogRocket Blog https://ift.tt/t0NZbjl
Gain $200 in a week
via Read more
Source link