What Is Kubernetes Debugging?
Kubernetes debugging refers to the process of diagnosing and fixing issues that arise when deploying, running, and managing applications in a Kubernetes cluster. Kubernetes is a complex system that can have many components, and debugging can be challenging when something goes wrong.
Kubernetes debugging typically involves collecting information about the state of the cluster, identifying the source of the issue, and then using that information to resolve the problem.
The Importance of Debugging in Kubernetes
Kubernetes debugging is crucial for ensuring the reliable and efficient operation of Kubernetes-based applications. Debugging a distributed cluster architecture can be particularly challenging due to the numerous components involved and their distributed nature. Identifying and resolving issues requires a deep understanding of the system architecture and a variety of debugging tools and techniques.
Another challenge of Kubernetes debugging is the security risks associated with exposing cluster ports to connect to an IDE or local machine. This can potentially expose sensitive data and lead to security breaches. Therefore, developers must take precautions to ensure that any connections to the cluster are secure and well-managed.
Creating local replicas is not a viable option since the environment variables are configured within the cluster. It can be difficult to recreate the exact same environment in a local machine, which can make it hard to reproduce and resolve issues.
Furthermore, since clusters host multiple pods, tracking issues can become more difficult. Developers need to ensure that they are tracking the correct pod and that they are debugging the correct container within that pod.
What Is the kubectl debug Command?
The kubectl debug command is a tool that allows developers and operators to troubleshoot Kubernetes applications by connecting a debugging container to a running pod. This feature was introduced in Kubernetes version 1.18 and is available in the kubectl command-line tool. If you are not so familiar with kubectl commands, check out this kubectl cheat sheet.
The kubectl debug command allows a user to spawn a new container within a pod to debug the application. This container is similar to the pod’s original container, with the addition of tools for debugging and troubleshooting purposes. Once the debugging container is running, the user can interact with it using standard debugging tools such as gdb, strace, and tcpdump.
The kubectl debug command has several benefits, including:
- Allows debugging without modifying the application or container images.
- Provides an isolated environment for debugging, separate from the production environment.
- Reduces the need to collect logs and reproduce issues in a separate environment.
- Streamlines the debugging process, reducing the time required to troubleshoot issues.
The kubectl debug command is a powerful tool for developers and operators who need to quickly identify and troubleshoot issues in Kubernetes applications.
Debugging Kubernetes Nodes with Kubectl
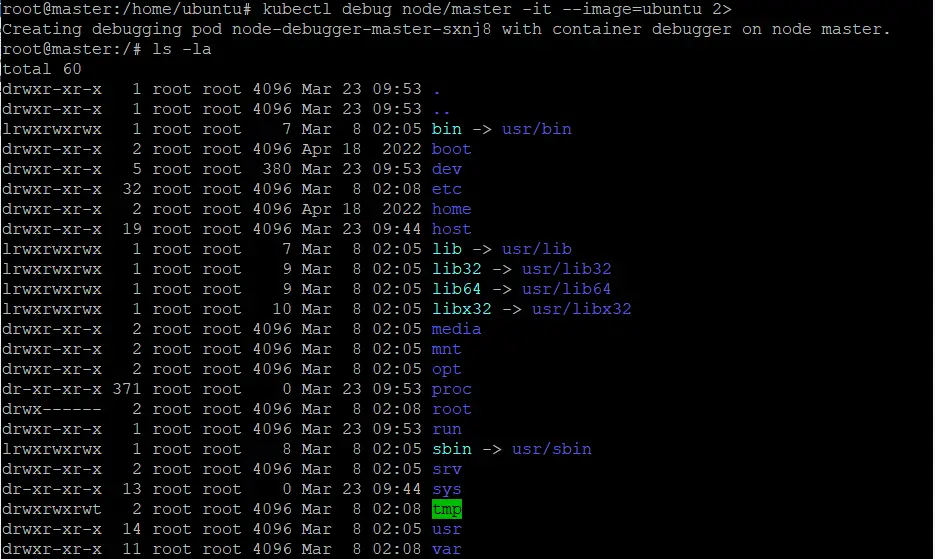
By using the command kubectl debug node, it is possible to deploy a pod to a given node for troubleshooting. This command is useful when the node cannot be accessed with an SSH connection. Once the pod is created, it will open an interactive shell on the node. You can create an interactive shell by running the following:
kubectl debug node/examplenode -it –image=ubuntu
The debug command allows you to collect information and troubleshoot Kubernetes issues. There are various commands that can be used in debugging, including ip, ifconfig, ping, ps, and nc. It’s also possible to install another tool from a package manager, such as tcpdump, mtr, or curl.
When you create the debugging session on your node, the debug command will automatically generate the new pod’s name based on the node’s name. The node’s root filesystem will be mounted at the /host location. The pod does not have privileges, even if the container is running in the host IPC, PID, and network namespaces. Thus, trying to read information about the process could result in failure because access to this information is restricted, and the pod is not a superuser. For instance, running the command chroot /host will cause a failure. If the pod requires privileged access, you can create the privileged pod manually.
Debugging Kubernetes Volumes
The kubectl debug command can be a helpful tool when debugging Kubernetes volumes. Here’s how to use the kubectl debug command to debug a volume issue:
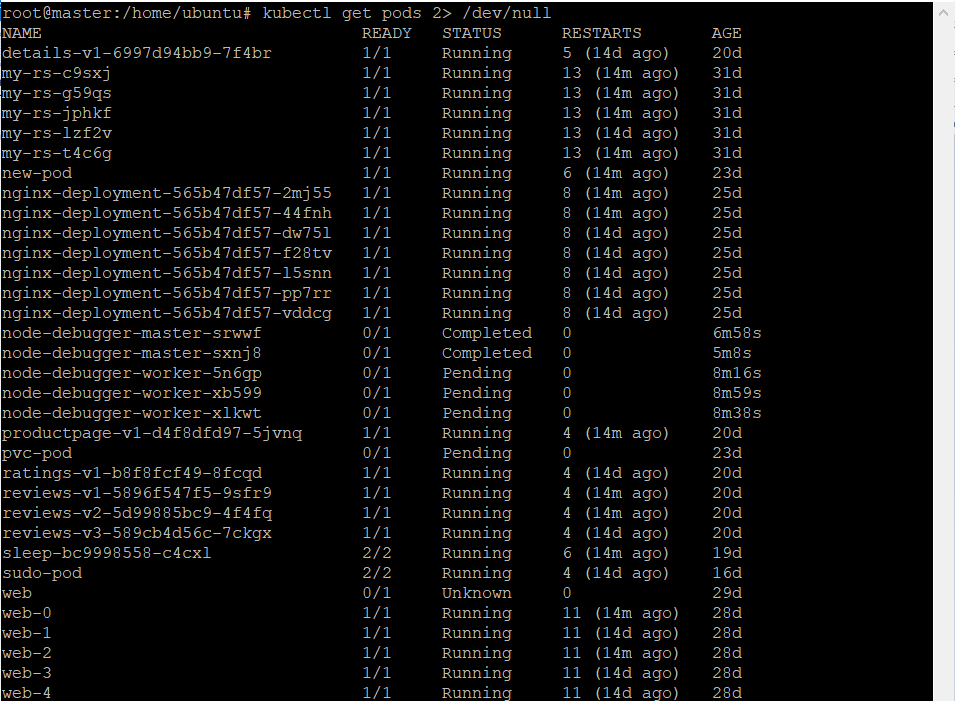
1.Identify the pod: Identify the pod that is experiencing the volume issue. Use the kubectl get pods command to list all pods in the namespace, and then identify the pod with the volume issue.
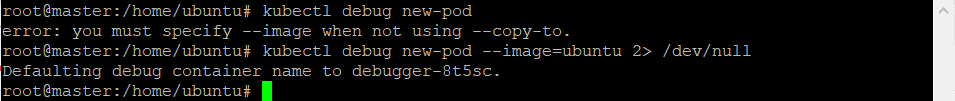
2.Launch a debugging container: Use the kubectl debug [pod-name] –image=[image-name] command to launch a debugging container within the pod. This will spawn a new container within the pod that can be used for debugging and troubleshooting.
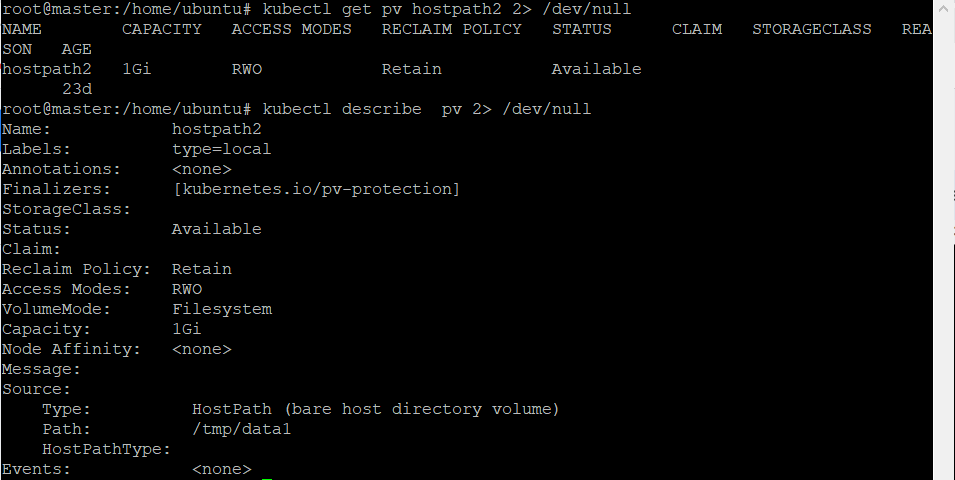
3.Check the volume status: Once the debugging container is running, use the kubectl describe pv command to check the status of the volume. This will display the current state of the volume, including any errors or warnings.
4.Check the pod configuration: Check the configuration of the pod that uses the volume, including the volume mount and container configuration. Verify that the mount path is correct and that the container has the correct permissions to access the volume.
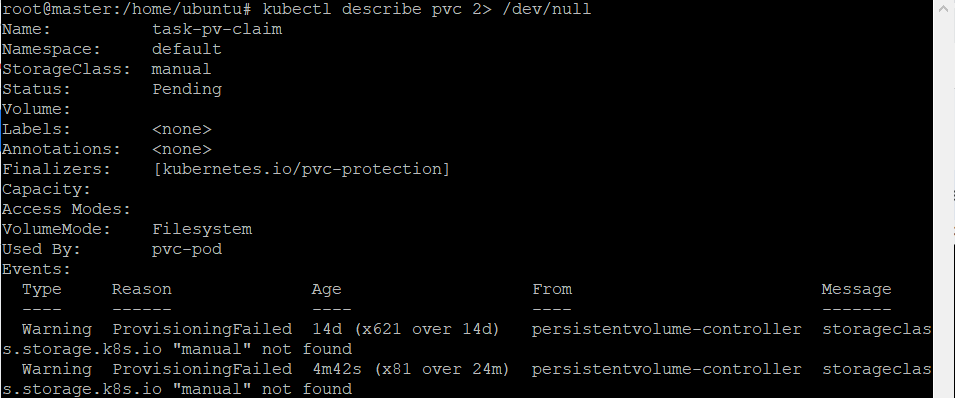
5.Check the PersistentVolumeClaim: Check the status of the PersistentVolumeClaim (PVC) associated with the volume using the kubectl describe pvc command. This will display any errors or warnings related to the PVC.
6.Check application logs: Look if there are any errors related to the volume or file system.
7.Try an alternative volume type: If the issue persists, try using a different volume type or storage provider to see if the issue is related to the specific volume type.
Conclusion
In conclusion, the kubectl debug command is a powerful tool that can greatly simplify the debugging process for Kubernetes-based applications. It allows developers to interactively troubleshoot issues within a container running in a Kubernetes cluster, without having to recreate the environment locally.
By following the steps outlined in this article, developers can identify and resolve issues related to volumes, network communication, container failures, and other factors that can impact the performance and reliability of Kubernetes-based applications.
However, it’s important to note that effective debugging requires a deep understanding of the Kubernetes architecture, as well as knowledge of the various tools and techniques used for troubleshooting. Developers should also be aware of the security risks associated with exposing cluster ports and take necessary precautions to ensure that any connections to the cluster are secure.
Author Bio: Gilad David Maayan

Gilad David Maayan is a technology writer who has worked with over 150 technology companies including SAP, Imperva, Samsung NEXT, NetApp and Check Point, producing technical and thought leadership content that elucidates technical solutions for developers and IT leadership. Today he heads Agile SEO, the leading marketing agency in the technology industry.
LinkedIn: https://www.linkedin.com/in/giladdavidmaayan/
Source link