Declarative diagramming creates diagrams using a declarative approach, from flowcharts to organization charts. In a declarative approach, the user specifies the relationships and logic of the diagram’s element using formal language rather than manually placing and connecting shapes on a canvas.
The resulting diagram is generated automatically based on the user’s input. Declarative diagramming can be particularly useful for creating complex diagrams that would be difficult to create manually or generating diagrams from data stored in a database or spreadsheet.
Additionally, declarative diagramming allows for greater flexibility in the design of the diagram and the ability to easily update and change the diagram as needed while saving time.
Jump ahead:
What is D2?
D2 (D2lang) is a domain-specific diagram scripting language that transforms text into diagrams. D2 takes the declarative diagramming approach and generates images based on the declared code syntax (text). Rather than being geared towards designers, D2 is marketed towards engineers. Using D2, you can create diagrams that declare shapes, connections, containers, and special objects. You can also make more customizations via programming that covers strings, comments, and overrides.
D2 supports various diagrams, including flowcharts, state diagrams, and entity-relationship diagrams. D2 also provides a wide range of customization options, allowing users to change the appearance of diagrams to match their organization’s branding and needs or conform to specific standards.
You can also create custom shapes and elements with D2, making it easy to create diagrams that accurately reflect the specific needs of your projects.
D2 is open source, and the Terrastruct project supports it. The Terrastruct project provides a set of tools for creating and maintaining infrastructure-as-code. The D2 syntax is simple and easy to learn and is an excellent addition to other tools like Terraform, Ansible, and others.
Getting started with D2
You’ll need to have D2 installed on your computer to transform the text into diagrams. Head to the installations documentation page to install D2 based on your computer’s resources and architecture.
Here’s how you can install D2 if you have the Go programming language installed on your computer.
go install oss.terrastruct.com/[email protected]
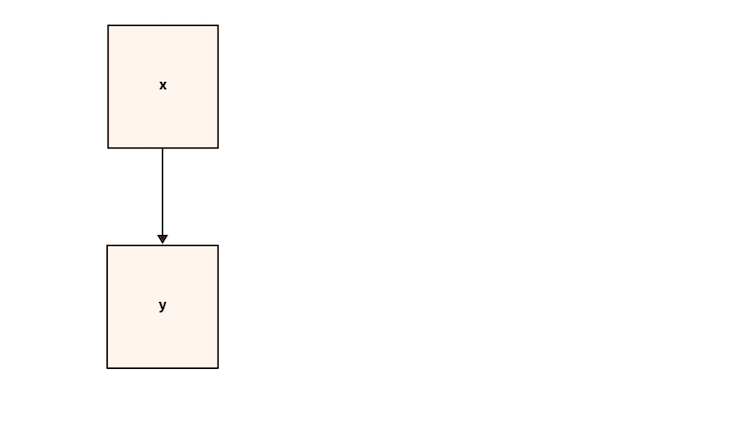
Run this command in your installation directory to verify that D2 is running:
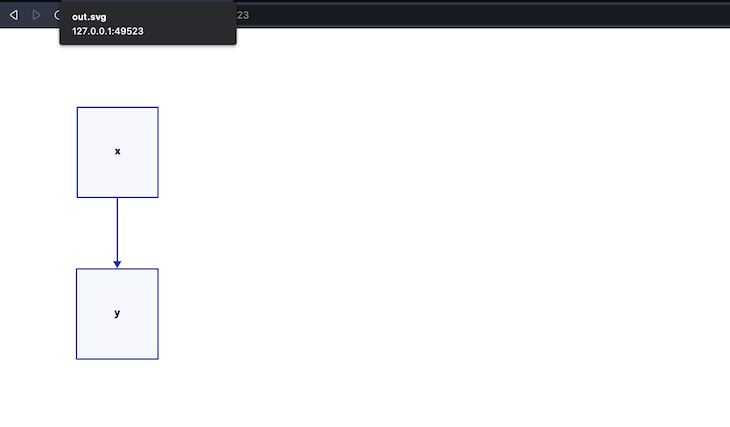
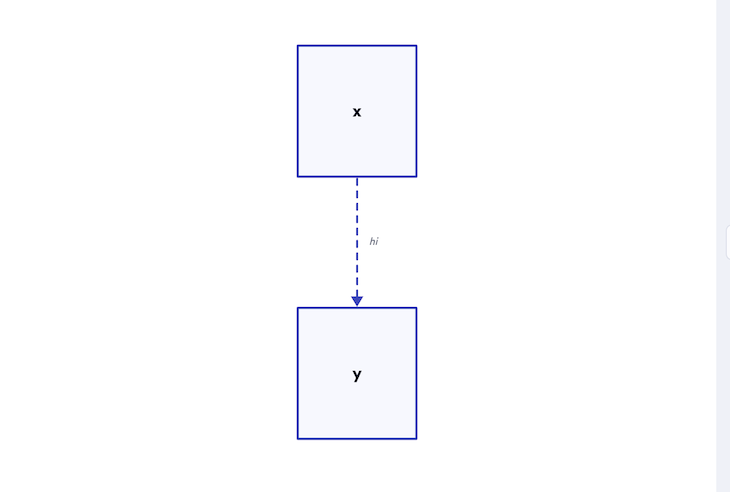
# creates a D2 file and adds the text
echo 'x -> y' > input.d2

# runs the text as with D2 and outputs an SVG diagram
d2 -w input.d2 out.svg
The command should start a server, open your default web browser, and display this diagram:
You also have options to install D2 with a CURL script if you have any problems with this approach.
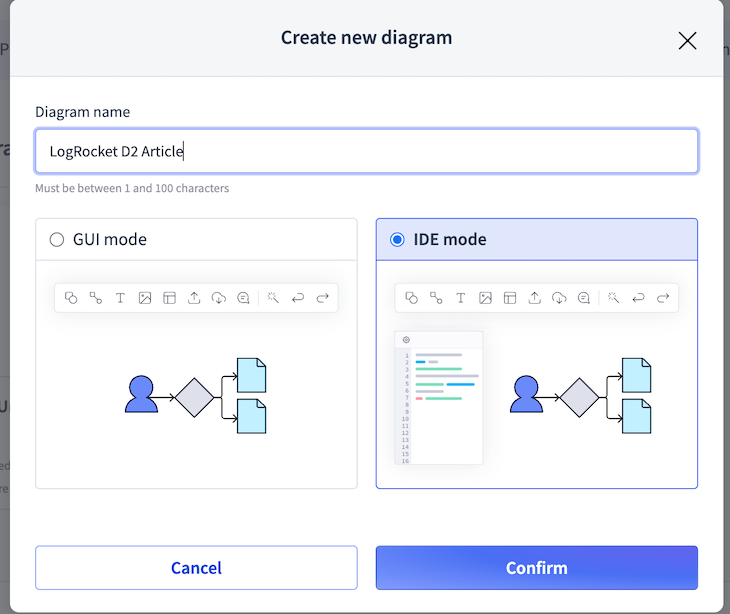
Alternatively, you can use the Terrastruct console that provides the regular GUI mode and an IDE mode to write and compile D2 code:
D2 also provides extensions and plugins for popular applications. There’s the D2 VSCode extension and Vim, Obsidian, Slack, and Discord plugins. The D2 community also has built third-party plugins and extensions for D2 support in applications like Telegram, Postgres importer, Emacs, and more.
Diagramming with D2
Declarative diagramming in D2 employs specific syntax rules you must follow to get your desired diagram.
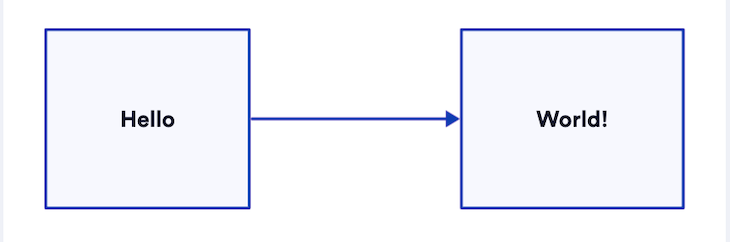
D2 supports most data types. You can write a Hello World or a text as a label in D2 by specifying the text after the diagram directive:
"Hello" -> "World!"
The syntax above declares a connection between two shapes, Hello and World!. The shapes are connected with a straight line from Hello to World!:
Working with shapes in D2
You can declare shapes in D2 by specifying a text. The default shape in D2 is the square:
this
You can use a semi-colon to declare multiple shapes in a diagram:
this; that
Squares aren’t the only shape in D2; you can use the shape field of a text to create an alternative shape:
Google Cloud.shape: cloud
Myapp.shape: circle
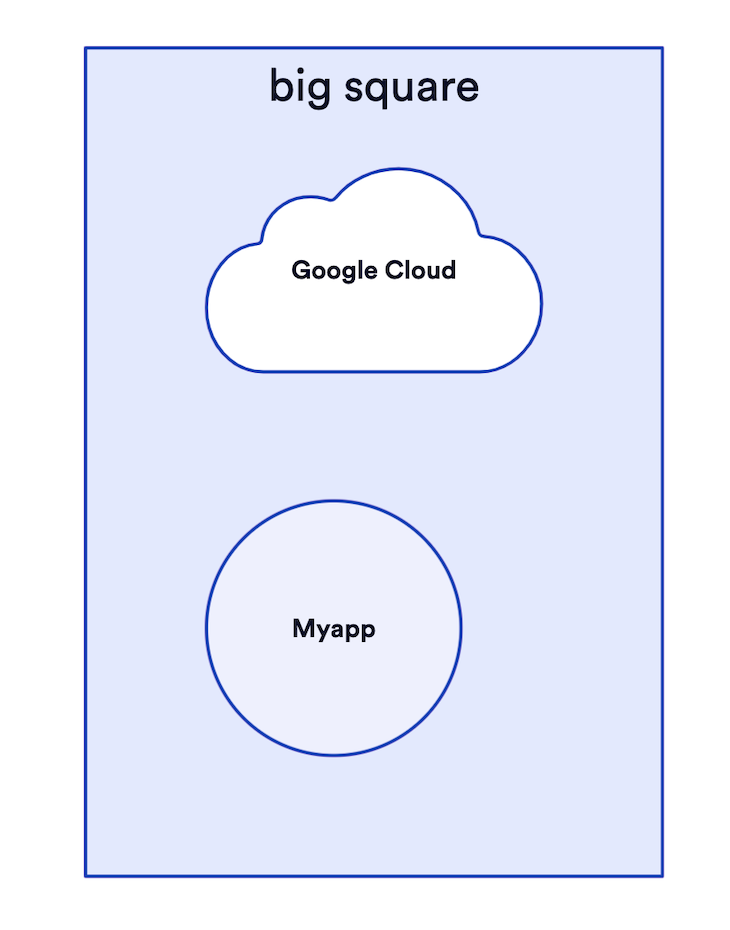
You can also wrap shapes in another shape by enclosing the shape(s) in braces, as well as specifying an identifier for the parent shape:
big square: {
  Google Cloud.shape: cloud
  Myapp.shape: circle
}
Connections and labels in D2
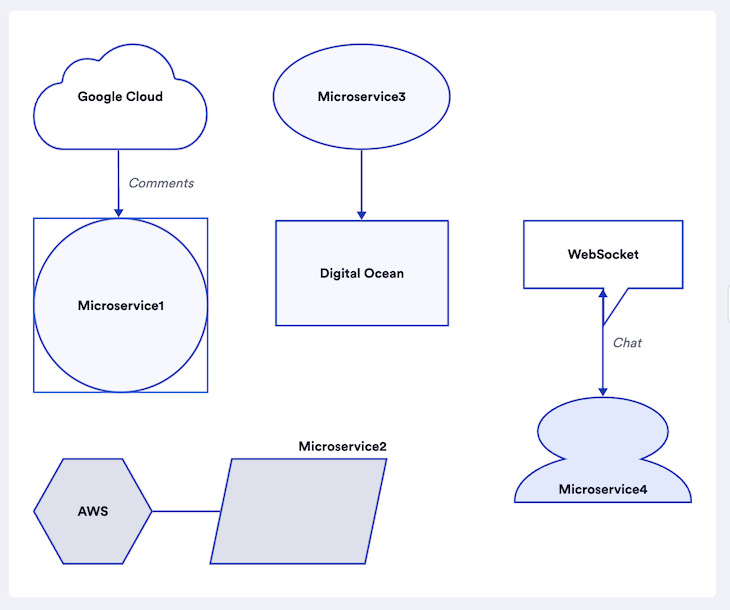
You can connect shapes and text in D2 with a connection operator and label connections by specifying the label after a colon (:) operator.
D2 provides four connection operators:
- The forward connector
-> - The straight line connector
-- - The forward connector
<- - The both sides connector
<->
Here’s how you can connect and label shapes in D2 using the aforementioned operators:
Google Cloud.shape: cloud
Microservice1.shape: circle

#  -> connects the google cloud shape to the Microservice1 shape with a "comment" label
Google Cloud -> Microservice1: Comments

Microservice2.shape: Parallelogram
AWS.shape: hexagon

# --  creates a straight line from the AWS shape to the Microservice2 shape

AWS -- Microservice2

Digital Ocean.shape: rectangle
Microservice3.shape: oval

#  -> connects the Microservice3 shape to the Digital ocean shape.

Digital Ocean <- Microservice3

Microservice4.shape: person
WebSocket.shape: callout

#  -> connects websocket and microservice4 shapes to each other with a "chat" label

WebSocket <-> Microservice4: Chat
Styling D2 diagrams
Styles and themes are the spice of diagrams. They add extra context and variety to the information being presented. D2 provides functionality for adding theses, styles, and dimensions to diagrams.
Adding themes to D2 diagrams
D2 supports many themes to make your diagrams look more professional. You can apply themes to specific shapes and tables.
You can set themes on D2 CLI by specifying a theme (theme number) with the -t or the --theme flags in your commands.
You can use the d2 command to specify themes like this:
# specifies the usage of theme 101
d2 -t 101 input.d2 out.svg
Here’s the output of the installation diagram with a different theme:
Alternatively, you can use the D2_THEME environment variable to specify themes to a diagram:
D2_THEME=101 d2 input.d2 out.svg
Customizing D2 diagrams
You can customize the styles of shapes and diagrams with the style field. Most styles use CSS keywords and follow CSS conventions. Here’s a list of the style options currently available with D2:
- Opacity
- Stroke
- Fill (shape only)
- Stroke-width
- Stroke-dash
- Shadow(shape only)
- Font-size
- Font-color
- Bold
- Italic
- Underline
- Stroke-dash
- Border-radius (shape only)
- 3D (rectangles/squares only)
- Multiple (shapes only)
- Animated (connections only)
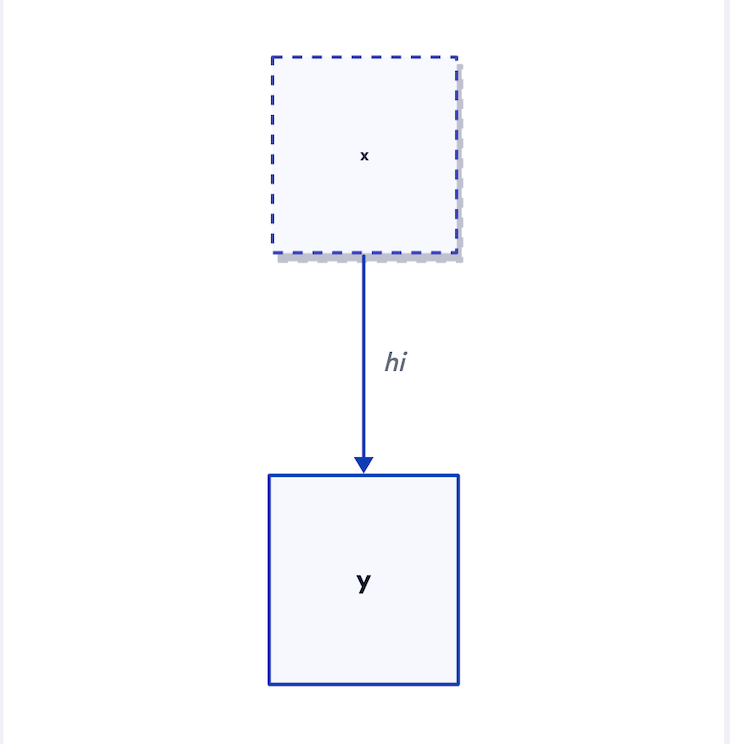
Here’s how you can style your diagrams with style fields:
x -> y: hi {
        # styles in the braces
  style: {
    opacity: 0.9
    stroke-dash: 3
    shadow: true
    font-size: 10
  }
}
Alternatively, style specific elements of your diagram with the <element>.style.<style-option> syntax:
x -> y: hi
x.style.opacity: 0.9
x.style.stroke-dash: 3
x.style.shadow: true
x.style.font-size: 10
x.style.3d: true
Adding dimensions to D2 diagrams
Additionally, you can specify the dimensions of your diagrams with the width and height keywords in your diagrams. You’ll need to add the quotes operator "" to specify dimensions:
print : "" {
  width: 50
  height: 50
}
Here’s the result of the dimensions declaration:

Strings in D2
D2 provides quoted and unquoted strings for flexibility; you can use both for your diagrams.
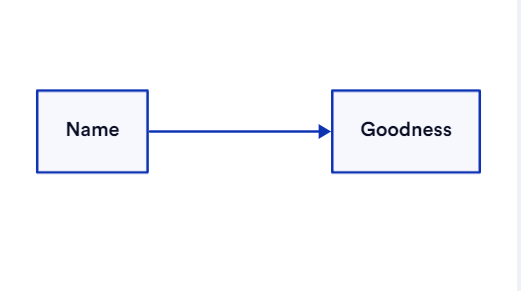
Unquoted strings come in handy for using alphanumeric values. D2 trims leading and trailing whitespaces, so you won’t have to worry about that:
My Name: Goodness
Name -> My Name
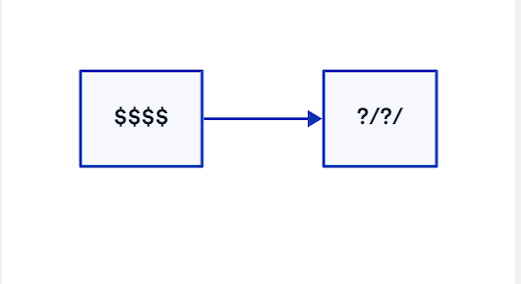
Quoted strings are useful for using symbols. Single and double quotes have the same effect on D2:
"$$$$" -> '?/?/'
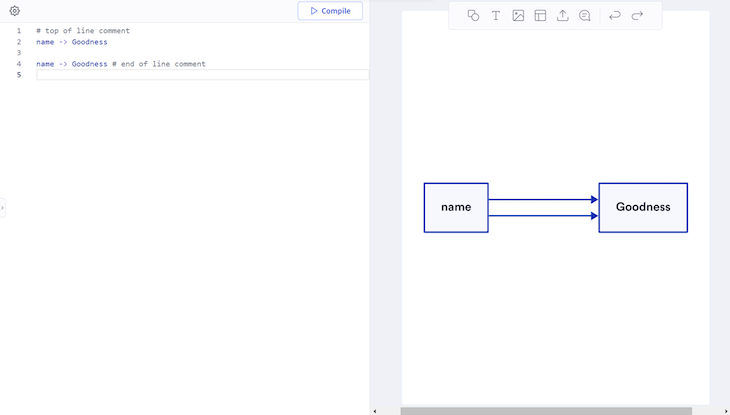
D2 uses Bash-style syntax for comments. This means that you can comment on your D2 code with the # symbol:
# top of line comment
name -> Goodness

name -> Goodness # end of line comment
There’s no different syntax for multiline comments in D2. Simply add more single-line comments to create multi-line comments:
Overrides in D2
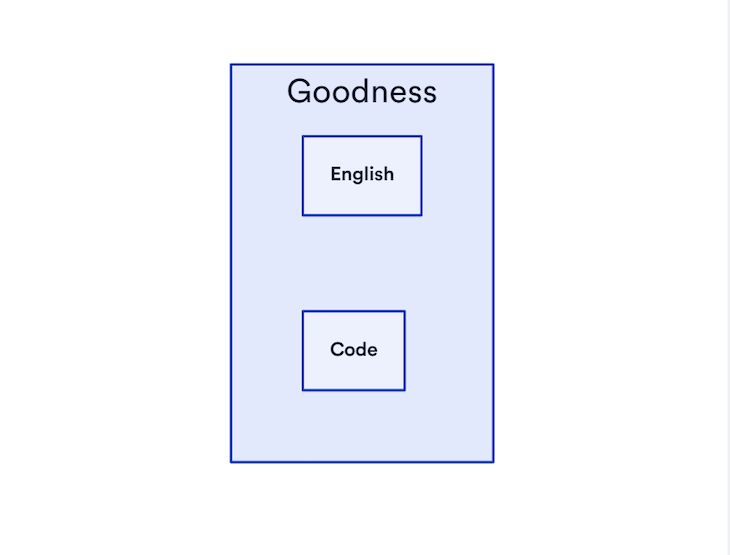
When you re-declare shapes, D2 merges new declarations with the previous one. The latest explicit label takes priority.
Here’s an example of how overrides work in D2:
name: Goodness {
  Language: English
}
name: Goodness {
  Book: Code
}

# is equivalent to this

name: Goodness {
  Language: English
  Book: Code
}
The name was declared twice with different data, and D2 merged both of them into the shape:
Conclusion
In this article, you learned how to install and get started with D2, the declarative diagramming language. You learned how to create diagrams and style their shapes, themes, and dimensions.
D2 is helpful in many cases, especially in automating diagrams that can change over time. Most D2 users use the language in their documentation and ERD diagrams.
Cut through the noise of traditional error reporting with LogRocket
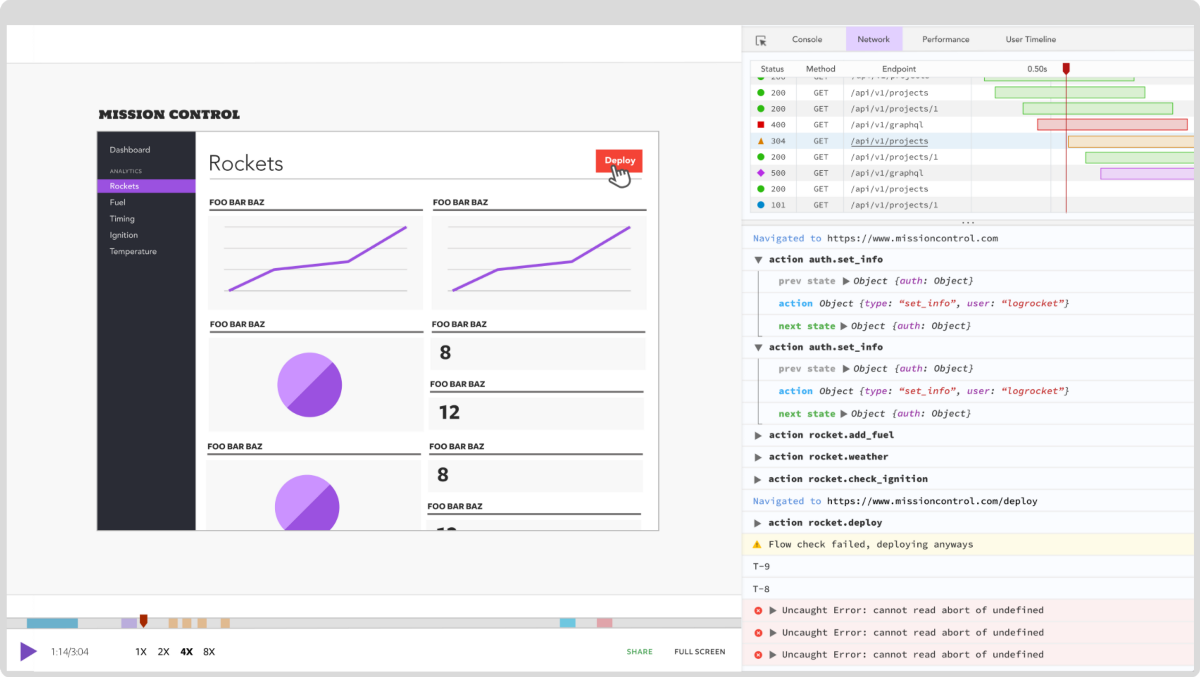
LogRocket is a digital experience analytics solution that shields you from the hundreds of false-positive errors alerts to just a few truly important items. LogRocket tells you the most impactful bugs and UX issues actually impacting users in your applications.
Then, use session replay with deep technical telemetry to see exactly what the user saw and what caused the problem, as if you were looking over their shoulder.
LogRocket automatically aggregates client side errors, JS exceptions, frontend performance metrics, and user interactions. Then LogRocket uses machine learning to tell you which problems are affecting the most users and provides the context you need to fix it.
Focus on the bugs that matter — try LogRocket today.
Source link