We’ve all been in situations where we need to make a decision between different products or services, but find it challenging to compare the options.
Which product has better features? Which service offers the best value for money? These are just a few of the many questions that can make the decision-making process difficult. That’s where feature comparison tables come in — a powerful tool for simplifying the process of comparing and contrasting different options.
In this article, we’ll walk you through how to design a feature comparison table step-by-step. We’ll also talk about some best practices to ensure that the comparison table is accessible, appealing, and persuasive. This will help your users make informed decisions and could lead to winning over potential customers.
Table of contents
What is a feature comparison table?
People make decisions all the time, and comparing different options is naturally part of the decision-making process. It’s normal for us to want to shop around to find the best deal, whether we’re deciding on which product to purchase, which service provider to choose, or which lender to sign up with.
A comparison table is a tool used in the decision-making process that helps weigh the pros and cons by displaying common features or characteristics in a clear, easy-to-read format. Often, we care about a few key things when making a decision such as a price, technical performance, or available features. It helps to see an overview of each option by highlighting the similarities and differences in order to make a choice that fits our needs.
Static vs. dynamic comparison tables
When designing a feature comparison table, a key consideration is whether to create a static or dynamic table.
A static comparison table is a simple table that displays information in a fixed format. The information in the table remains the same, and the user cannot interact with the table to change the displayed information. Static tables are useful when the information being compared is not likely to change frequently.
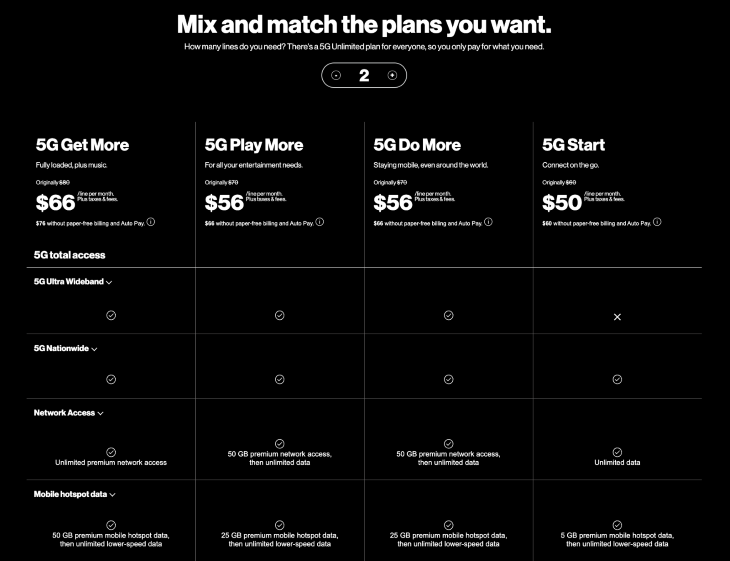
A dynamic comparison table, on the other hand, allows users to interact with the table to change the displayed information. The user can select which products or services to compare, and the table will update to display the relevant information. Dynamic tables are useful when there are many products or services to compare, and the user needs the ability to filter and sort the data.
How to design a feature comparison table
1. Identify the purpose of the table
The first step to creating a feature comparison table is to define the purpose and identify the target audience. This will help determine the relevant features to compare and the level of detail required.
Some purposes of a feature comparison table can include:
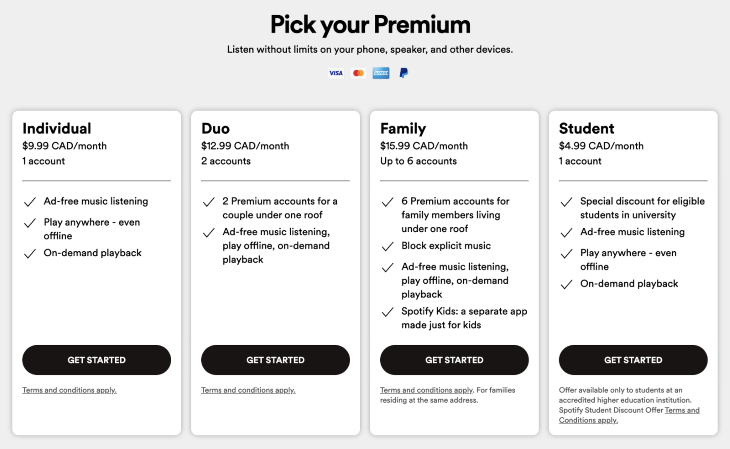
- Upselling a certain level of membership or plan
- Outlining the differences between competing products or services
- Analyzing data for market research
2. Gather data
The next step is to research the products or services being compared and collect data from various sources such as product manuals, company websites, customer reviews, and competitor analysis.
Focus on collecting data that will help the viewer in the decision-making process, such as prices, performance specs, or any unique features. It’s important to ensure that the data collected is accurate, up-to-date, and relevant to the target audience.
3. Organize the data and determine the table format
Once the data has been collected, it needs to be organized in a structured and easy-to-read manner. The table should have a clear and concise layout with headings and subheadings that guide the reader through the information.
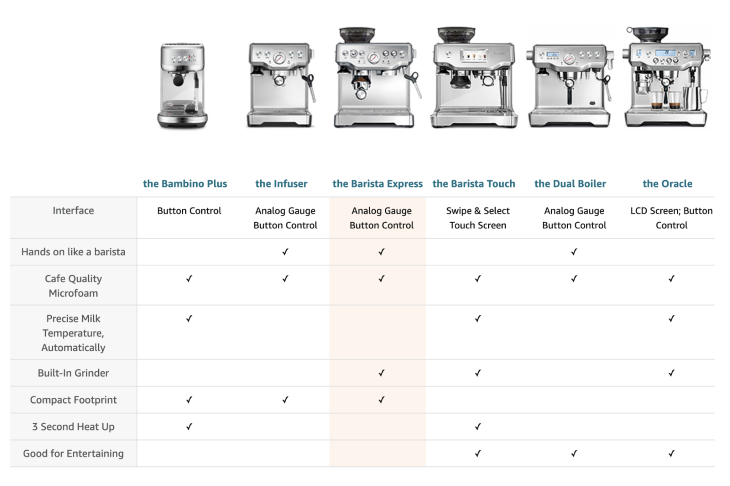
The categories or features being compared can be listed in a column on the left-hand side, with the corresponding information displayed in columns to the right. Alternatively, a simple pillar format could be better suited to avoid cluttering the table.
UX best practices
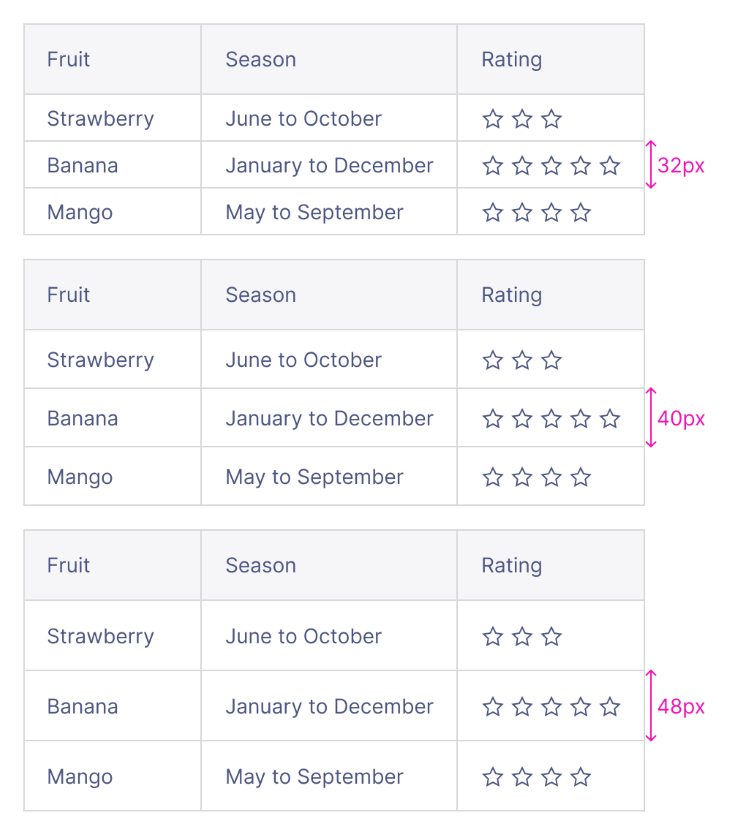
Row height
Row height can make a big difference in the readability of the table. Condensed rows can make the table look cluttered, while tall rows can make it harder to compare the information by spacing out the table too much.
In general, use enough whitespace and avoid cluttering the table with too much information or unnecessary details.
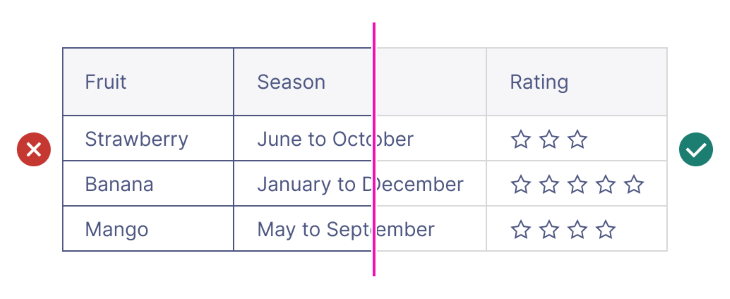
Row and column separators
Row and column separators may not always be necessary, as they can add more visual clutter to the table. If you prefer to add separators to the table, use a light color that doesn’t clash with the text color to maintain focus on the information instead of the table itself.
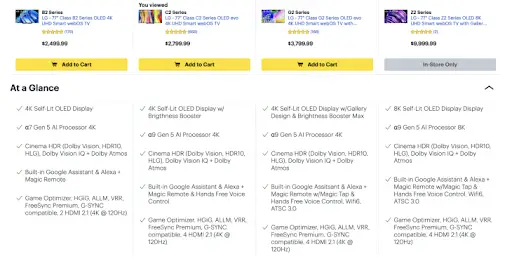
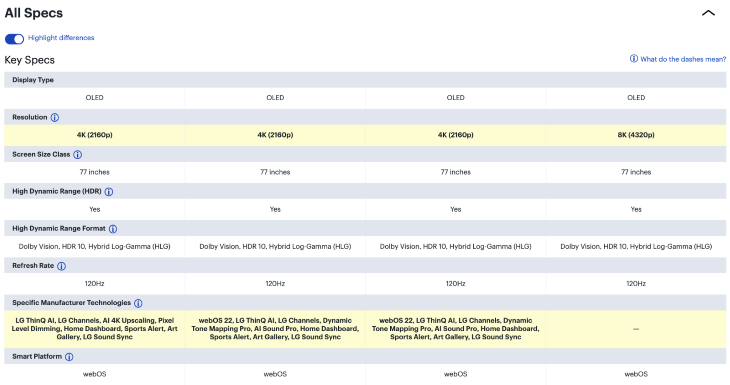
Highlight differences
Use color, bolding, or icons to highlight key features or differences between the options. This will help the reader quickly identify the most important information.
Consider giving the user the option to only show the differences. By hiding the attributes that are the same across the board, it makes the comparison process much easier for users.
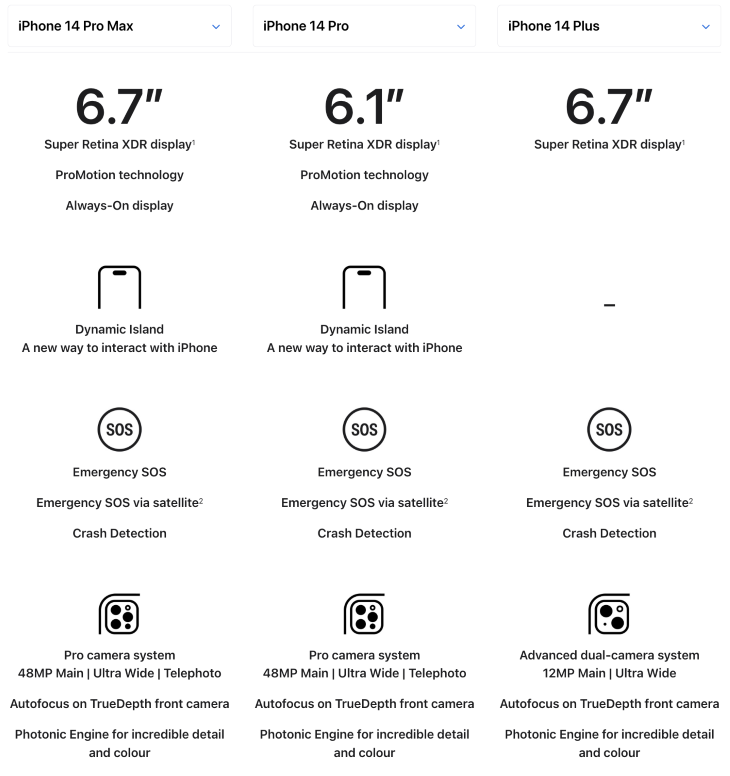
Visuals
Using graphics, images, or icons can help illustrate the information and make the table more visually appealing. This can also help break up the text and make it easier to scan.
Keep your visuals simple and easy to identify. Effective iconography is universally understood by audiences from any background.
Accessibility best practices
Making sure your feature comparison table is navigable for people with disabilities is important to ensure that everyone has access to the same information. By building accessibility into the table, everyone can consume the same information, leading to a higher potential for conversion.
Here are some best practices to follow to ensure that your comparison table is fully accessible.
HTML tags
Use proper HTML tags to structure the table, such as <thead>, <tfoot>, and <tbody> to make the header, footer, and body section of the table accessible to screen readers.
Image alt text
Provide alternative text for images used in the table. This allows visually impaired users to understand the content of the table.
Descriptive links
Use descriptive links for any hyperlinks in the table. Link descriptions should tell the user where the link will lead them and should be understandable even without the surrounding text. This helps users understand the purpose of the link without relying on visual cues.
Keyboard accessibility
Ensure that the table can be navigated using the keyboard alone. This includes the ability to move between cells using the tab key and the ability to select cells using the spacebar or enter key. When defining the tab order of the table, follow a left-to-right, top-to-bottom flow so that it makes logical sense to keyboard users.
By following these best practices, businesses can ensure that their comparison tables are navigable for people with disabilities. This not only helps to improve accessibility but also ensures that all users have an equal opportunity to make informed decisions based on the information provided.
Captions
Captions are provided to screen readers using the <caption> element. They can help screen reader users identify the table and understand its overall purpose. It can also include information to help the viewer navigate and find certain content within the rows and columns.
Making the feature comparison table persuasive
Comparison tables should be persuasive to the audience and help guide them into making a decision. Although comparison tables shouldn’t be biased toward one option over another, they should ultimately be able to persuade the viewer based on the information presented.
Here are some best practices for using data and sources to make a comparison table persuasive.
Information sources
Use information from reliable sources, such as industry reports, customer surveys, or third-party reviews. Without sources that can back up your claims, your audience may be skeptical of the information in the table and add friction to their decision-making process.
Data relevancy
Ensure that the data is relevant to the options being compared. Identify the most important features that set your product or service apart from competitors and highlight them in the comparison table.
Consider filtering or leaving out information that isn’t crucial and is the same across the board. However, similar information may still be useful to see if it is a key part of the decision-making process, such as the screen size of a TV or the storage capacity of a smartphone.
It can also help to provide context for the data being presented, such as how it compares to industry standards or competitors.
Data visualizations
Using charts, graphs, or metrics to visualize the data can make it easier for users to understand and interpret quantitative information. Similar to images or graphics, data visualizations are a great way to simplify numeric data and help the user understand the differences at a glance.
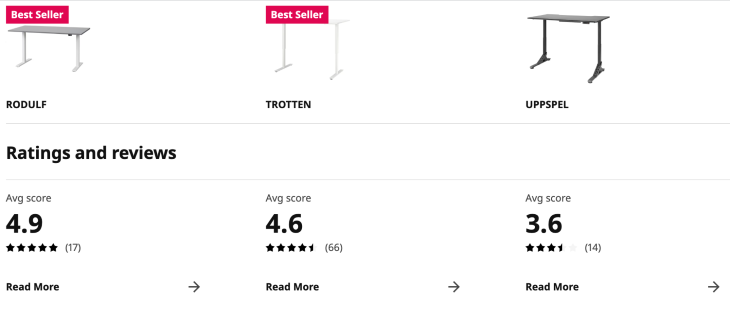
Benefits and reviews
Purchase decisions can be difficult, even after comparing features in a comparison table. Rather than just listing features, emphasize the benefits that come with each feature. This helps users understand how each feature will improve their experience with the product or service.
Additionally, incorporate customer reviews, testimonials, or ratings into the table to provide social proof and further convince users to choose your product or service.
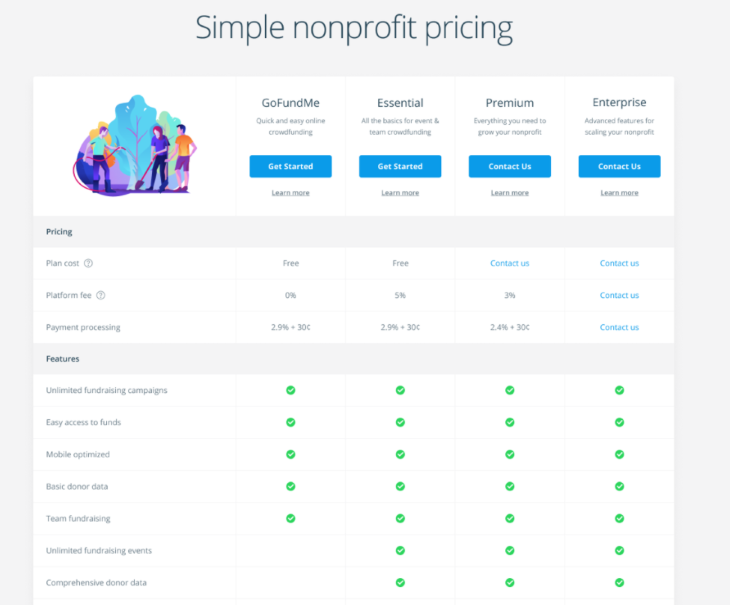
Calls-to-action (CTAs)
End the comparison table with a strong CTA that encourages users to take the next step, such as making a purchase or signing up for a membership.
This integrates the comparison table into a flow that directly leads to conversions. CTAs can also be included in the table cells themselves, such as a “Contact us” CTA to put the user in touch with your business.
Conclusion
In a nutshell, feature comparison tables save people time when making tough decisions between products or services. Whether you choose to design a static or dynamic comparison table, it’s about presenting credible information in a persuasive way.
By following UX best practices and accessibility guidelines, you can ensure that your comparison table is easy-to-read and ultimately help make the decision-making process a breeze for your users.
The post How to design feature comparison tables that simplify decision-making appeared first on LogRocket Blog.
from LogRocket Blog https://ift.tt/Hbz1wiM
Gain $200 in a week
via Read more
Source link